OSP Metrics & Data
For the fiscal year ending June 30, 2013, the University of Utah received $361.2 million in new awards for sponsored activities.
Overall Sponsored Project Awards
total Costs (prime and subawards)
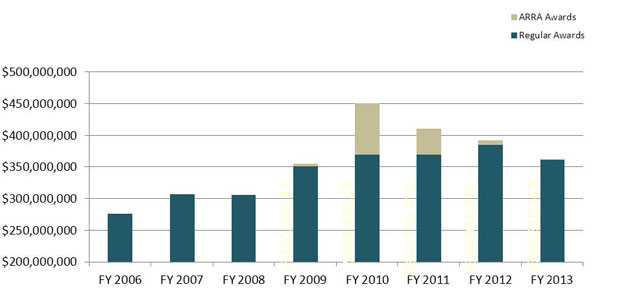
The $361.2 million is the total of approximately $361 million in regular awards and $276 thousand in ARRA awards. While the total number of awards increased by 4%, this years' total funding was down compared to FY12, due primarily to sequestration and the deep, automatic spending cuts which began in March 2012.
Overall growth since 2006 reflects the continued efforts of a growing body of investigators and the support of numerous faculty and staff.
Overall Sponsored Project Activity – Applications and Awards
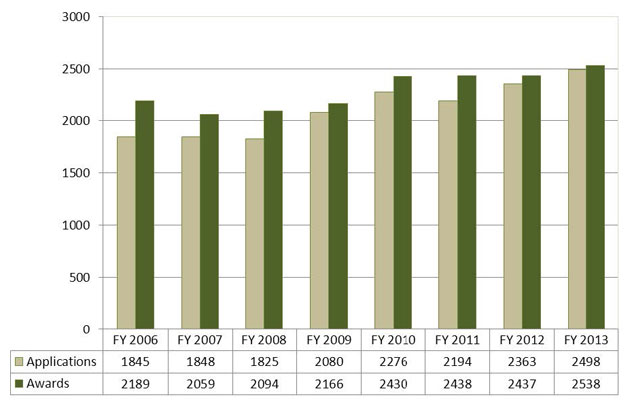
OSP submitted 2,498 applications and received 2,538 awards. Compared to last year, the number of submitted proposals grew by 5% percent and the number of awards increased by 4%.
In 2013, each Sponsored Project Officer reviewed approximately 200 applications and negotiated 208 new awards in addition to administering an existing workload, on average, of more than 200 projects.
FY13 Sponsored Activity Funding by Source
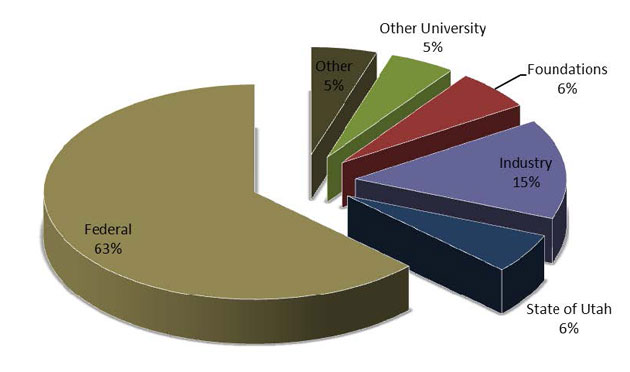
The largest sponsor of research at the University is the federal government, which accounted for $224 million of awards received in the last fiscal year. When you include flow-through, federal sources accounted for $226 million and 63% of the University's total research funding in FY13.
The second largest sponsor was private industry, which accounted for $53 million and 15% of the total research funding.
FY2013 Sponsored Project Funds by Federal Agency
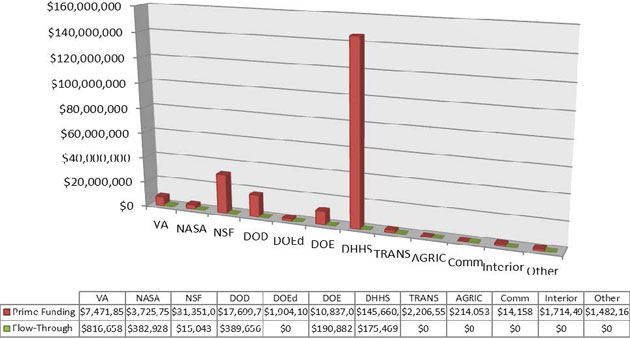
Our largest federal sponsor is the U.S. Department of Health and Human Services (DHHS). In 2013, we received $145.6 million in prime funding and just over $175 thousand in flow-through funding from DHHS. The National Science Foundation (NSF) provided $31.3 million in prime funding and $15k in flow-through and was the second largest federal sponsor in 2013.
For more sponsored project data and comparisons by administering department or college, please review the monthly trustee reports compiled and published by OSP.
FY2013 Federal Funding Updates (Provided by the VPR)
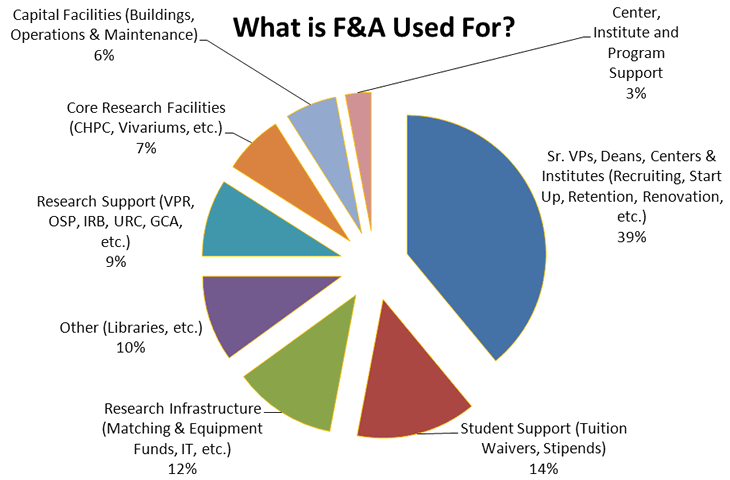
This 2013 Federal Funding Updates (PPT) includes graphs on national data and national trends as well as University specific data. It also includes the following data on what F&A is used for at the University. Additional information on F&A can be found here.
See also archived FY12 Metrics & Data